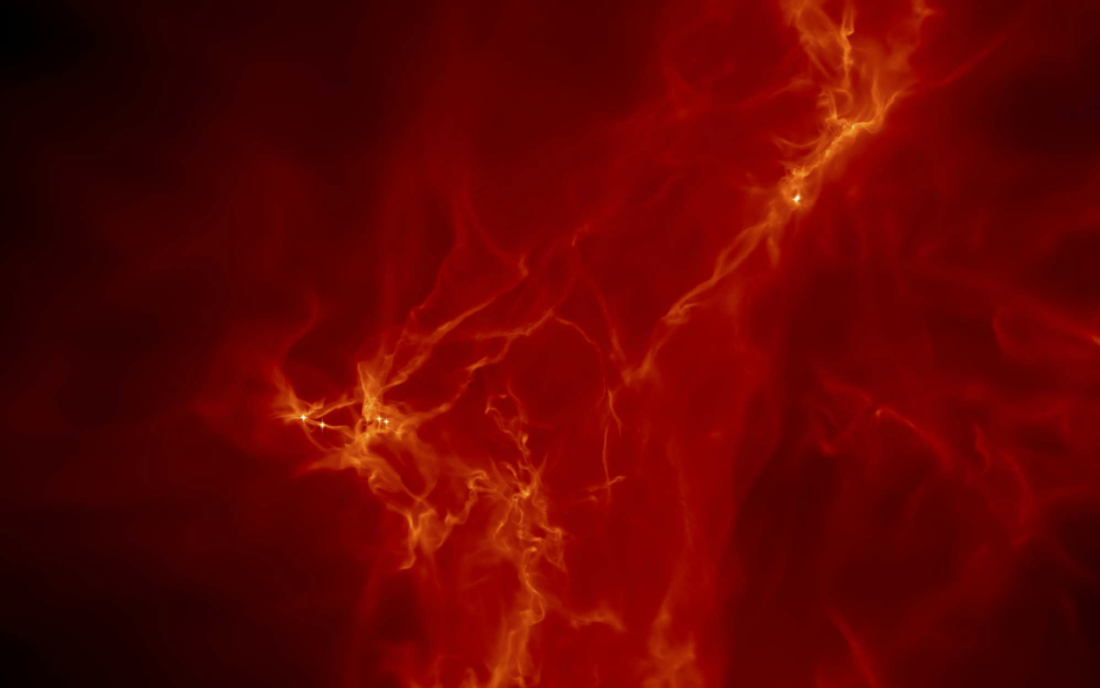
Although the data from satellites such as Herschel and Gaia provide a new insight into how stars form, it can still be tricky to piece together the history of an individual region. The observations see only a snapshot in time of a process that can take millions of years. Computer simulations can help us understand how clusters form, evolve and eventually disperse, giving us insights as to the history of our observed objects. The group at Cardiff University is tasked within StarFormMapper to run these computer simulations, and is making use of a new, state-of-the-art astrophysics simulation-code called Arepo. The simulations are able to follow how gravity brings together gas in the interstellar medium, and turns this gas into the dense cores where stellar clusters form. The images below show a snapshot from the simulation and reveal the different physical properties of the gas that the simulation is able to trace.
The image shows the column density in one of our simulations, which can be thought of as the amount of material along the line of sight. This simulation follows the gravitational collapse of a cloud with enough mass to form 10,000. Although this sounds like a lot, its actually on the low end! Most clusters form in clouds about tens times more massive this! Even our own Sun is likely to have formed alongside a cluster of siblings in cloud at least this massive. We stir the cloud with supersonic turbulent motions which help create the filamentary structures that you see in the cloud. This turbulence also provides energy that, alongside the thermal (heat) and magnetic energy in the cloud, fights against gravity, preventing the cloud from forming stars. However, in the densest regions within these filaments, gravity is able to pull the material together to form stars. As we can see, the little star symbols show the places where gravity has won!
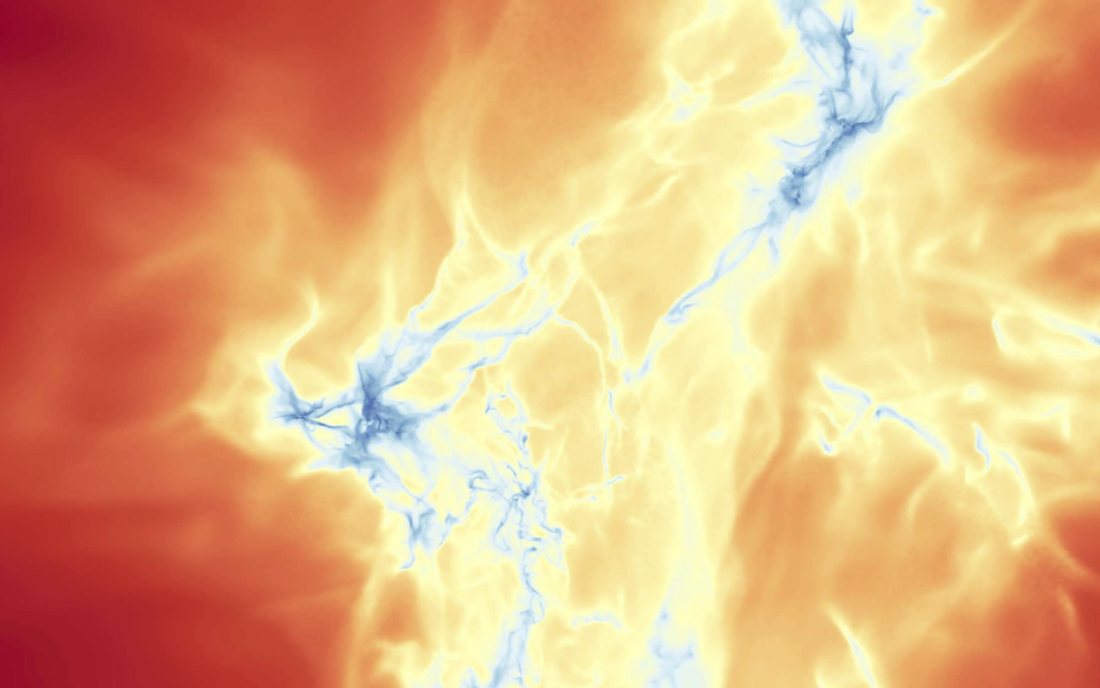
The simulations are also able to trace the temperature of the cloud as it evolves. The gas in star-forming regions is mainly heated by star-light both from stars that form within the cloud, as well as those that have formed in neighbouring gas clouds. As we mentioned above, the heat helps fight gravity and so it is important to see where the cold regions in the cloud are situated. As it happens, the starlight has difficultly reaching the dense regions that are formed by the turbulence, so these regions are also cooler than the lower-density surroundings of the cloud. In our image, blue represents around 10K while the orangey-red regions are around 60K.
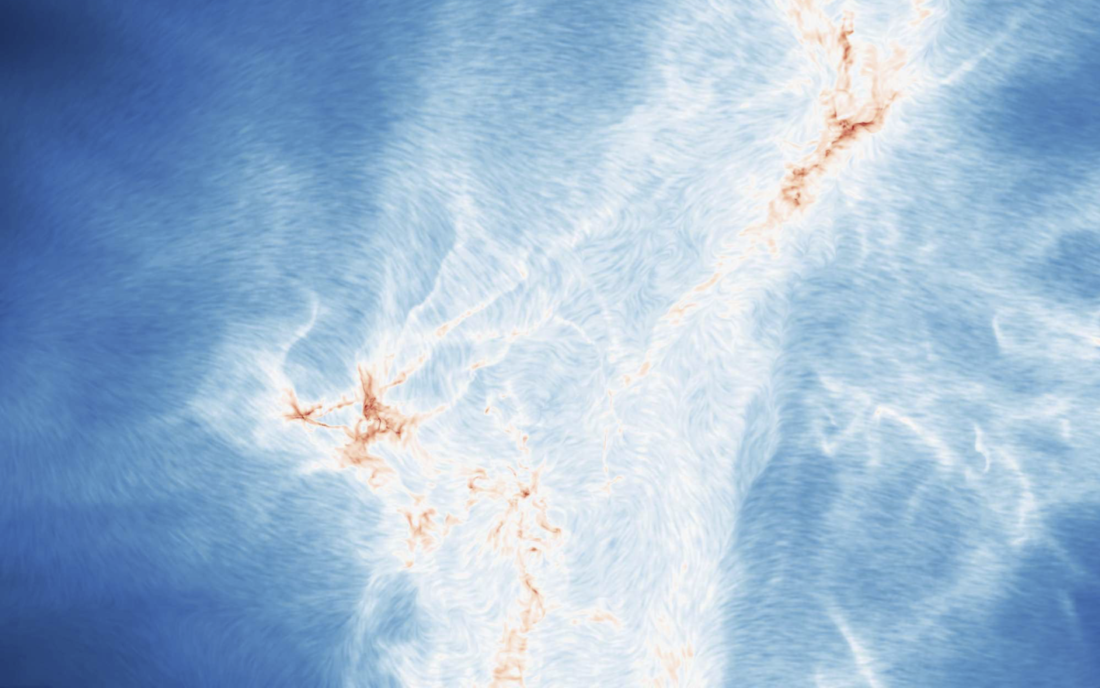
This image shows how the gas is moving in the cloud. The blue-red image shows the same column density that we see in the red image (or top image). The white flecked-striations however show the direction along which the gas in the cloud is moving. In some cases we see that the filaments are being formed by the motions (so they are in the process of being compressed), but in other cases the velocities are much more confused!
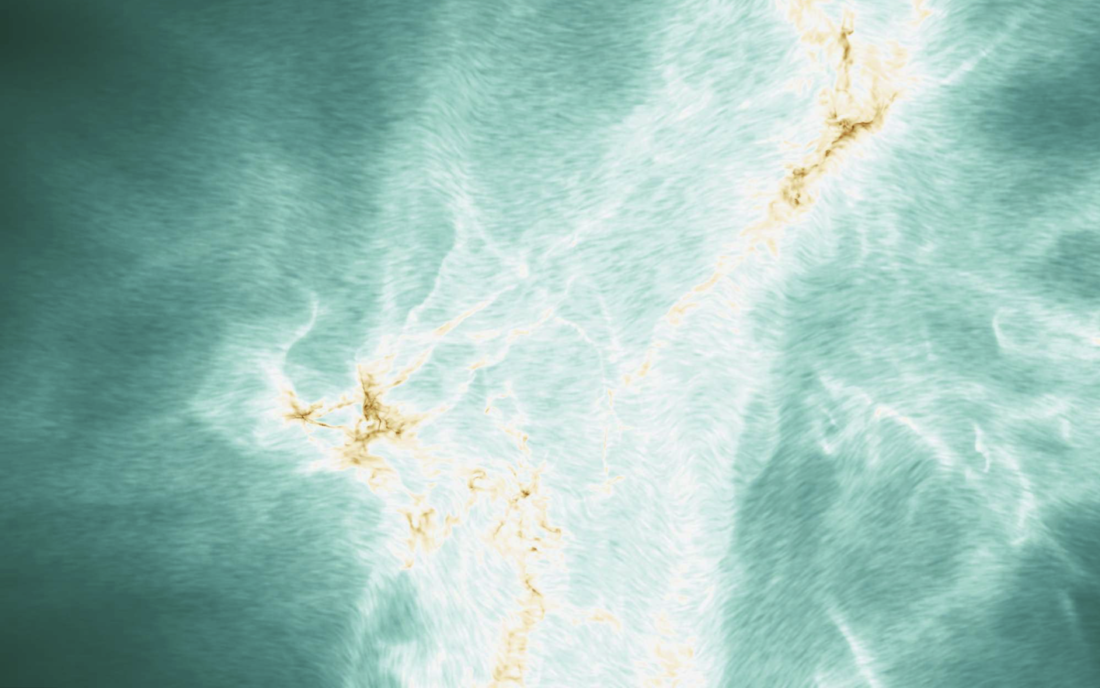
Similar to the velocity image, the green image shows the direction of the magnetic field. Mainly we can see that the magnetic fields are also typically perpendicular to the filamentary structures. This makes sense, since the gas finds it easier to flow along the field-lines that perpendicular to them. However, there are once again cases where the field lines are more confused around filaments. This could be a sign that these filaments have been formed by gravity, and something that the Cardiff group is now exploring.